Stan Wasserman mentioned a graphic from a Grantland article that was basically a visualization of a 2-mode matrix representing actors who have appeared in multiple HBO shows. Since i’m a fan of a handful of HBO’s shows, and i thought this might make for an interesting example in my undergrad networks class, i went ahead and turned the graphic into a usable network file.* You can grab the full matrix as an Excel file (which should be pretty easily importable into basically any format you prefer to use) here.

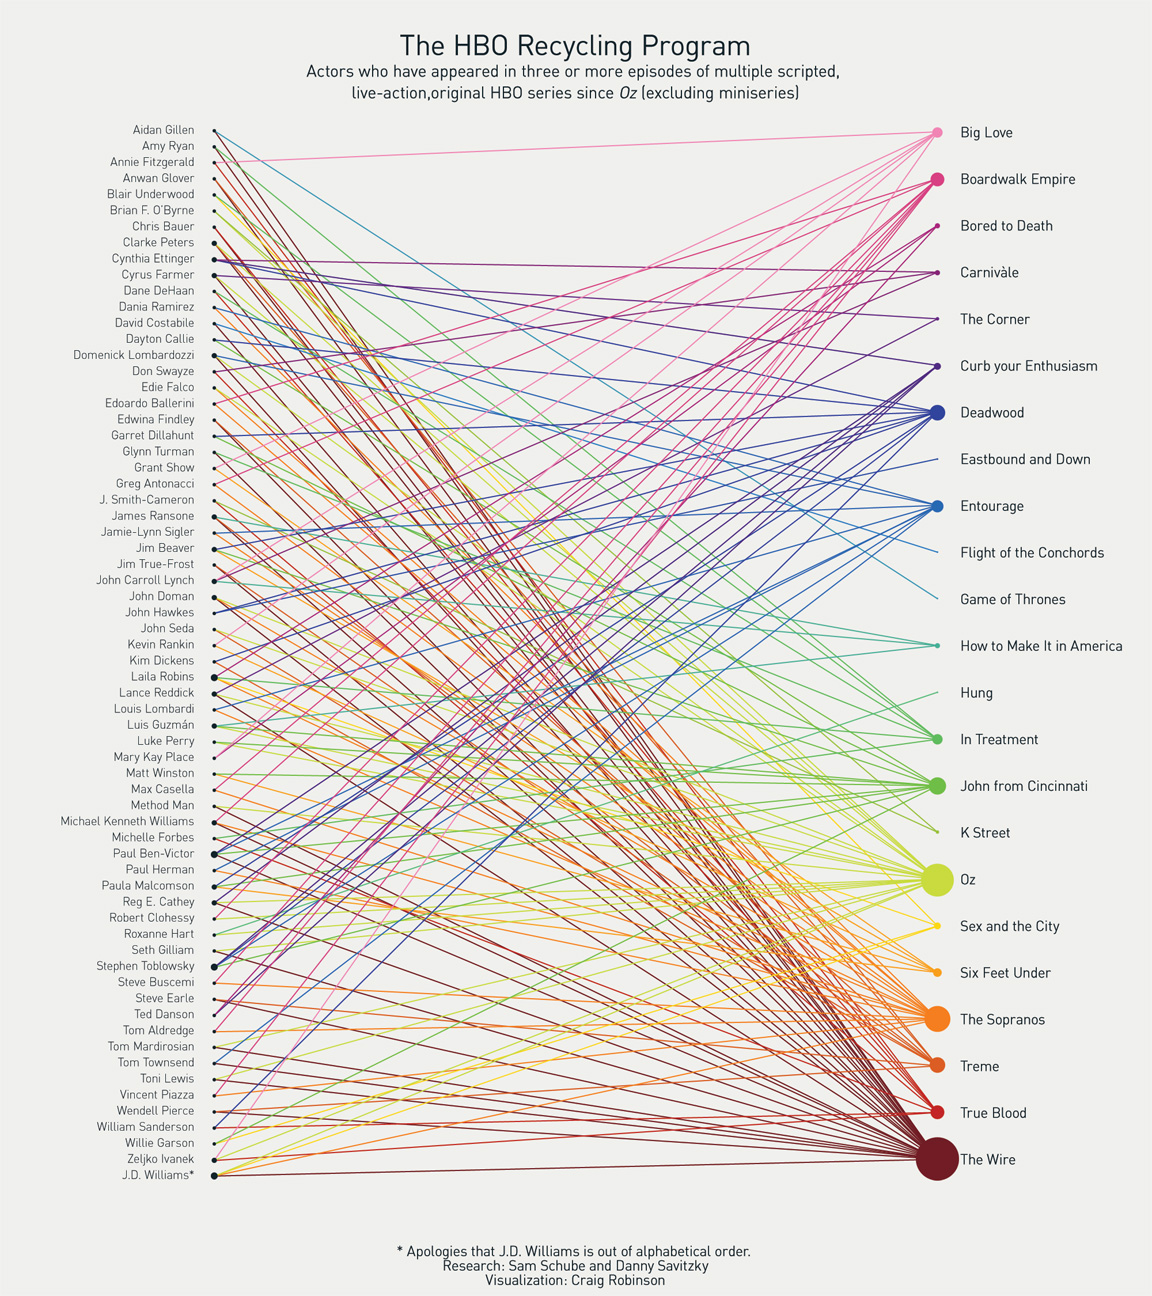
I’m futzing around with analyzing the network a little, but I don’t actually work directly with 2-mode data a lot*** so i haven’t gotten too far in thinking about this one. So, if you feel like grabbing the data and find anything interesting in there, please let me know. Above is an unlabeled version of the full diagram (where lines simply represent an actor – red nodes – appearing in a particular series – blue nodes). If you’re a fan of HBO shows, can you make any guesses about what you see (same image with labels after the jump)?
Here’s the same image with labels (click to enlarge). How’d your guesses go?

Not surprising to those aware of either of the shows – Oz and The Wire are really closely related, and Treme** draws from a lot of the same pool that those two used (the 2-mode “factions” algorithm in UCINet identified a primary group including those plus The Corner and a few others). That’s easier to see in the 1-mode projection of shows only (again, click to enlarge), where ties now sharing actors across shows, and are weighted according to the number of actors who jointly appeared in both shows (thicker = more shared actors).
 One of the things i was surprised by in this image was how well connected two shows i’d never even heard of before this – John from Cincinnati and Carnivàle – were to the other shows, through relatively many different actors and relatively few, respectively.
One thing this doesn’t say anything about is the implicit claim in the Grantland piece that HBO’s frequency of re-appearing actors is somehow unusual. I mean “holding deals” for networks aren’t new things, and many of the major networks seem to do something similar. So, perhaps a question worth pursuing would be whether HBO (or some other network) appears to do this more than others (though doing that properly would require large IMDB scrape to get the relevant data). And more directly to the claims in the article, if you had those “full data” and could link them up with some sort of performance indicator (ideas)- are actors who follow this path truly stuck in some sort of “purgatory”?
_______
*Since i don’t have Gabriel Rossman’s web-scraping skills, i basically did this manually from the Grantland graphic with a strong helping hand from some IMDB searches when my eyes went blurry trying to follow the lines across my screen. My suspicion is that there are likely a few actors, shows and links that this may be missing that would complete this story, but i’m pretty sure i faithfully reproduced at least what the Grantland piece had.
**IMO, Treme, which just wrapped up its second season is definitely the best drama, if not the best show period, on TV right now. If you haven’t seen it, i’d highly recommend checking it out on Netflix or HBO On Demand.
***I do work with 1-mode projections of 2-mode data in one project using really large-scale data, so that’s quite a different experience than this.

very interesting, i’ll have to think about this some more.
three thoughts:
1) you can download the entire IMDb from http://www.imdb.com/interfaces#plain
however it’s a ton of data and in a kind of weird format so if you’re just interested in a just a handful of shows/movies you’re better off scraping. speaking of which, the new IMDB web interface is a pretty weird structure so I wouldn’t bother trying to scrape it but wikipedia stores cast and crew lists as very clean html tables so you should be able to scrape it with the R library XML
2) my first thought was that the particular affinity between shows might be explained by sharing a show-runner but I don’t think that’s right as it doesn’t explain the John–Carnivale tie strength. i’m thinking a better way to explain it may be temporal. that is, they aren’t going to cast somebody in two shows at once so overlap in terms of actors may be driven by NOT overlapping in time.
3) talk to Jenn Lena and/or Mark Pachucki for ideas about how to present bipartite data as such (rather than 1-mode projections). also Brian Uzzi’s work on Broadway teams.
this is a good start, jimi……
one-mode analyses are just not the way to proceed, i think.
correspondence analysis!
the VISZARDS, at the Sunbelt meetings, have played with the entire IMDB database….. maybe like 5 years ago?
sw
For this sort of stuff, i think i agree about not using 1-mode projections, but it really has to depend on the question, right?
i guess that’s also why i stopped with the futzing, i wasn’t entirely sure the sorts of questions i’d be interested in answering with (just) these data. I did run them through the correspondence analysis algorithm in UCINet, but wasn’t really sure what would be expected/not, so didn’t go to far in thinking through the results.
Pulling them together did get me thinking about the sorts of questions i would use something like these to begin thinking about though (the last paragraph being just a start down those lines).